Threats View
The Threats view provides real-time security monitoring with KPI cards, threat timeline charts, and a live security event feed. This is the default view when opening the SOC dashboard.
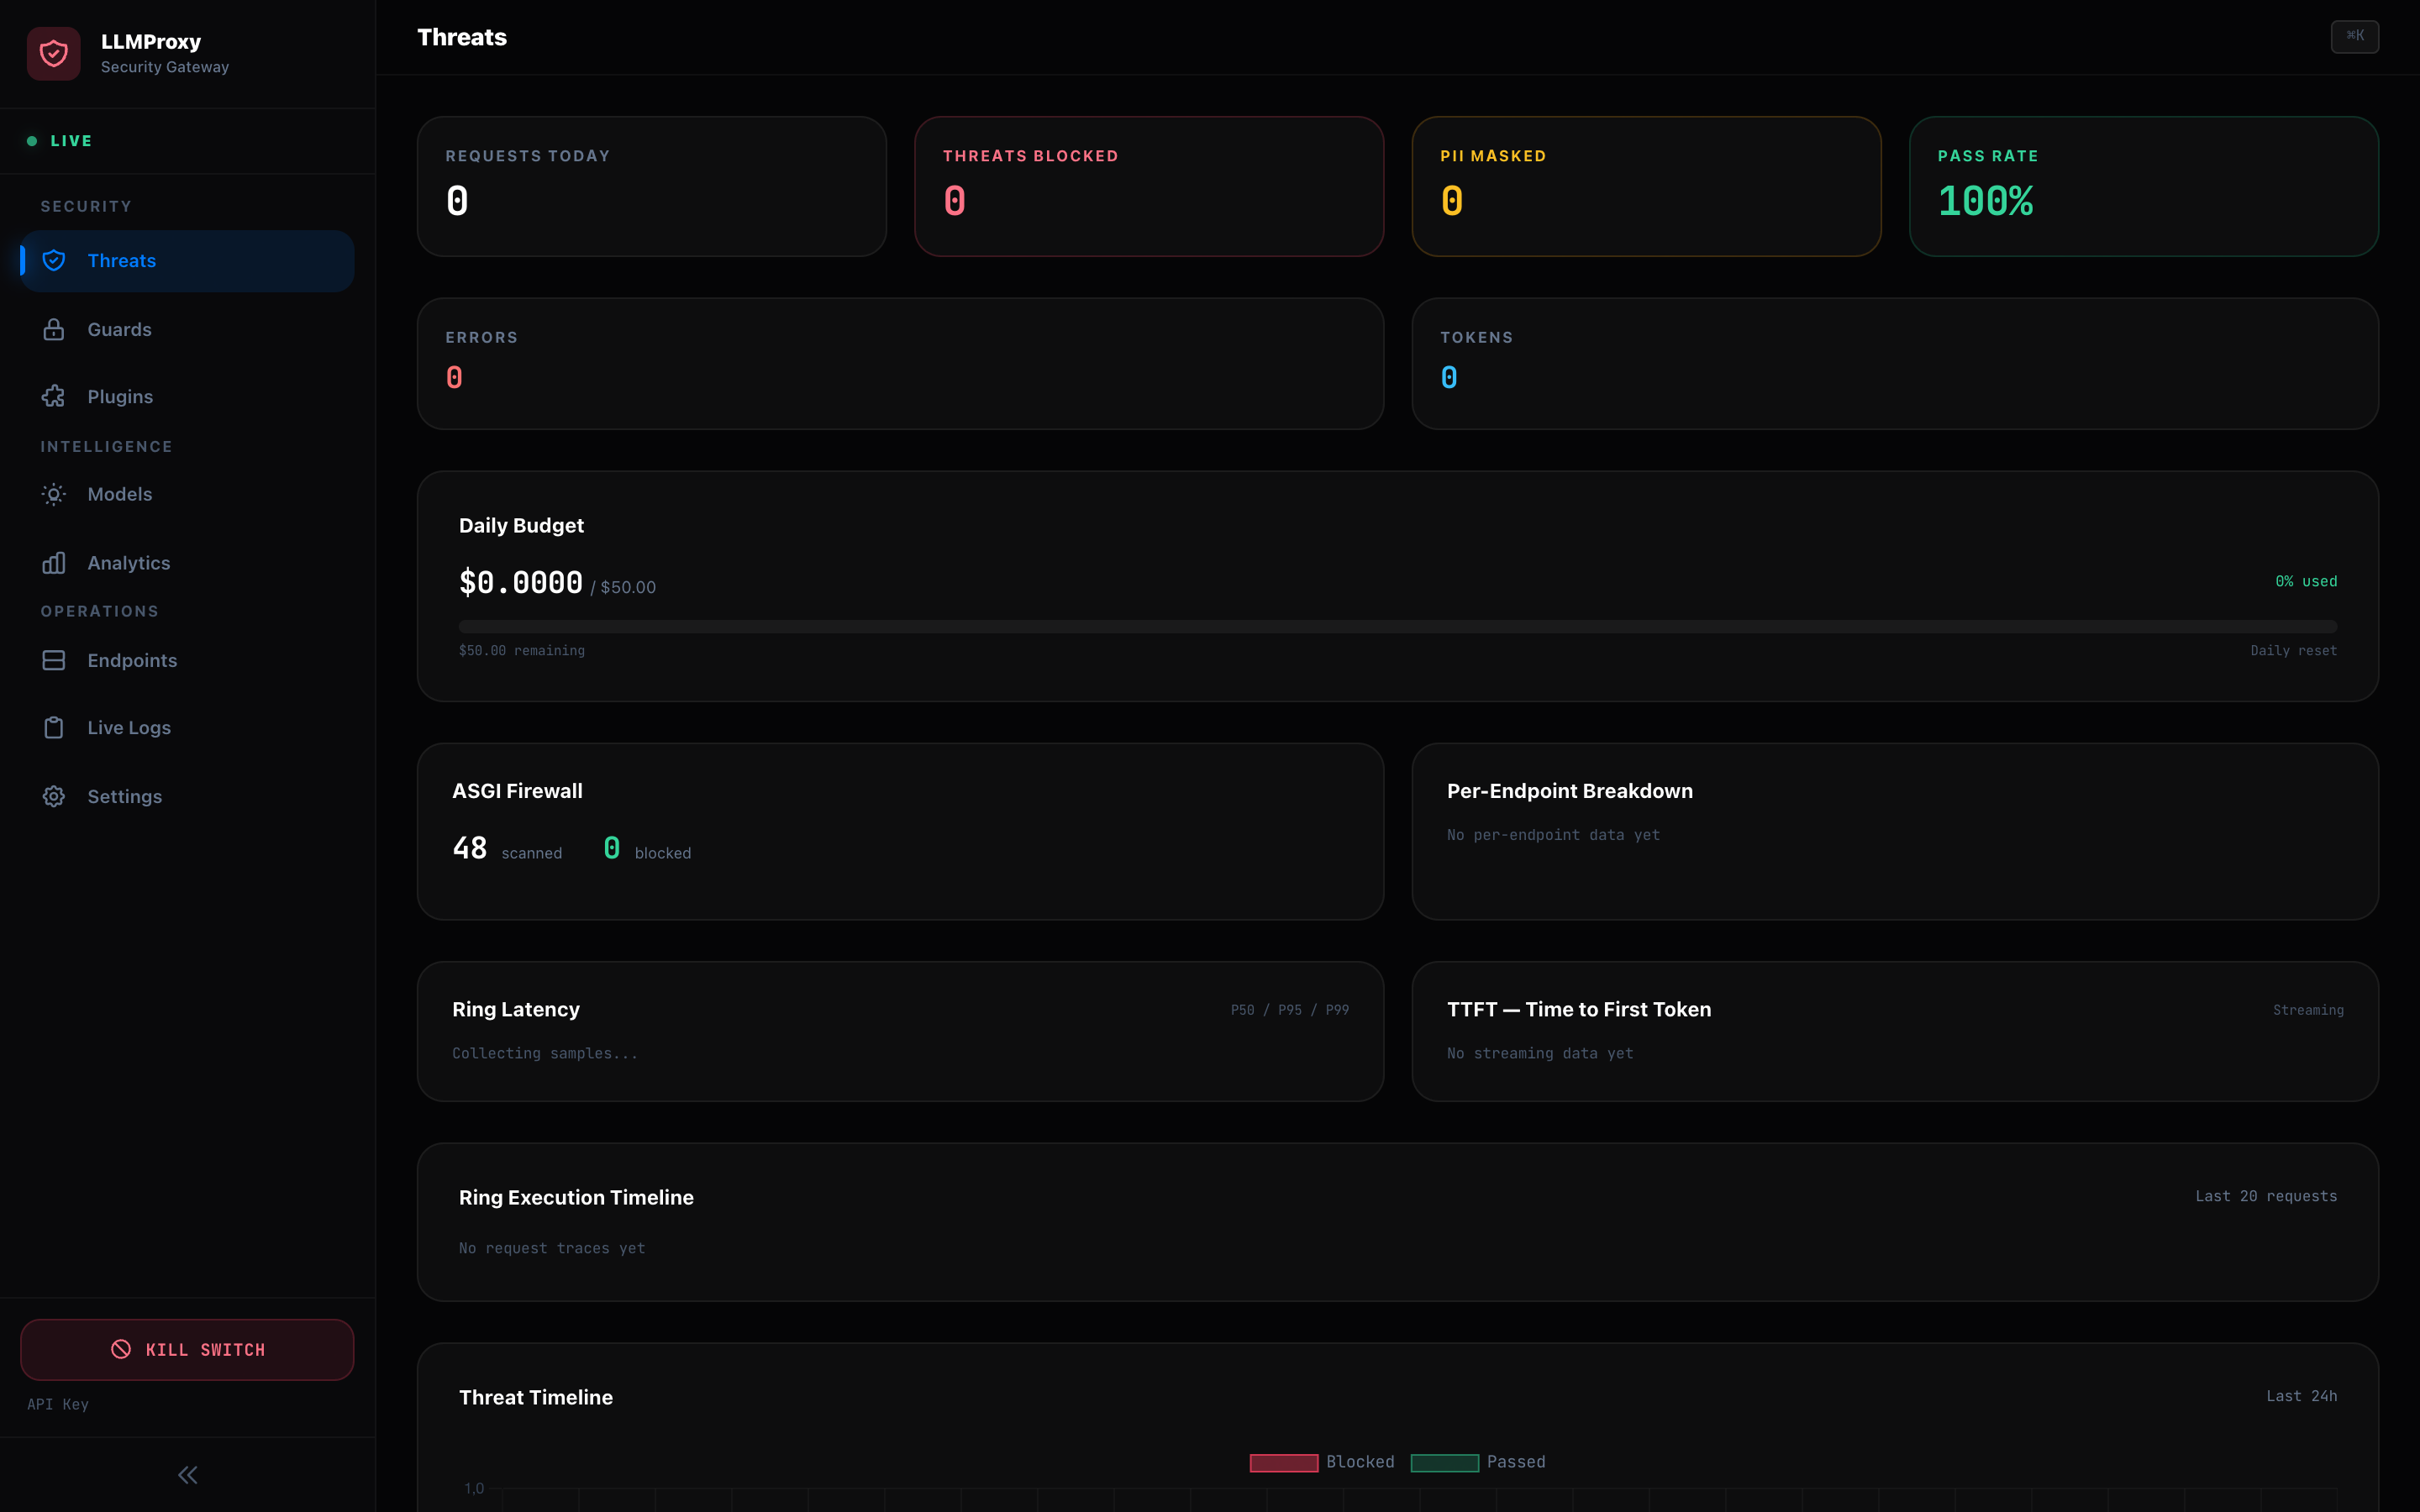
KPI Cards
Four key performance indicators updated in real-time:
| Card | Description |
|---|---|
| Total Requests | Total proxied requests since startup |
| Blocked | Requests blocked by firewall, SecurityShield, or plugins |
| PII Masked | Requests where PII was detected and masked |
| Pass Rate | Percentage of requests that passed all security checks |
Threat Timeline
A Chart.js line chart showing security events over time:
- Blocked requests
- Injection attempts
- PII detections
- Circuit breaker events
Security Event Feed
Real-time SSE feed showing the latest security events with:
- Timestamp
- Event type (injection, PII, firewall, budget, etc.)
- Severity level
- Request details (anonymized)