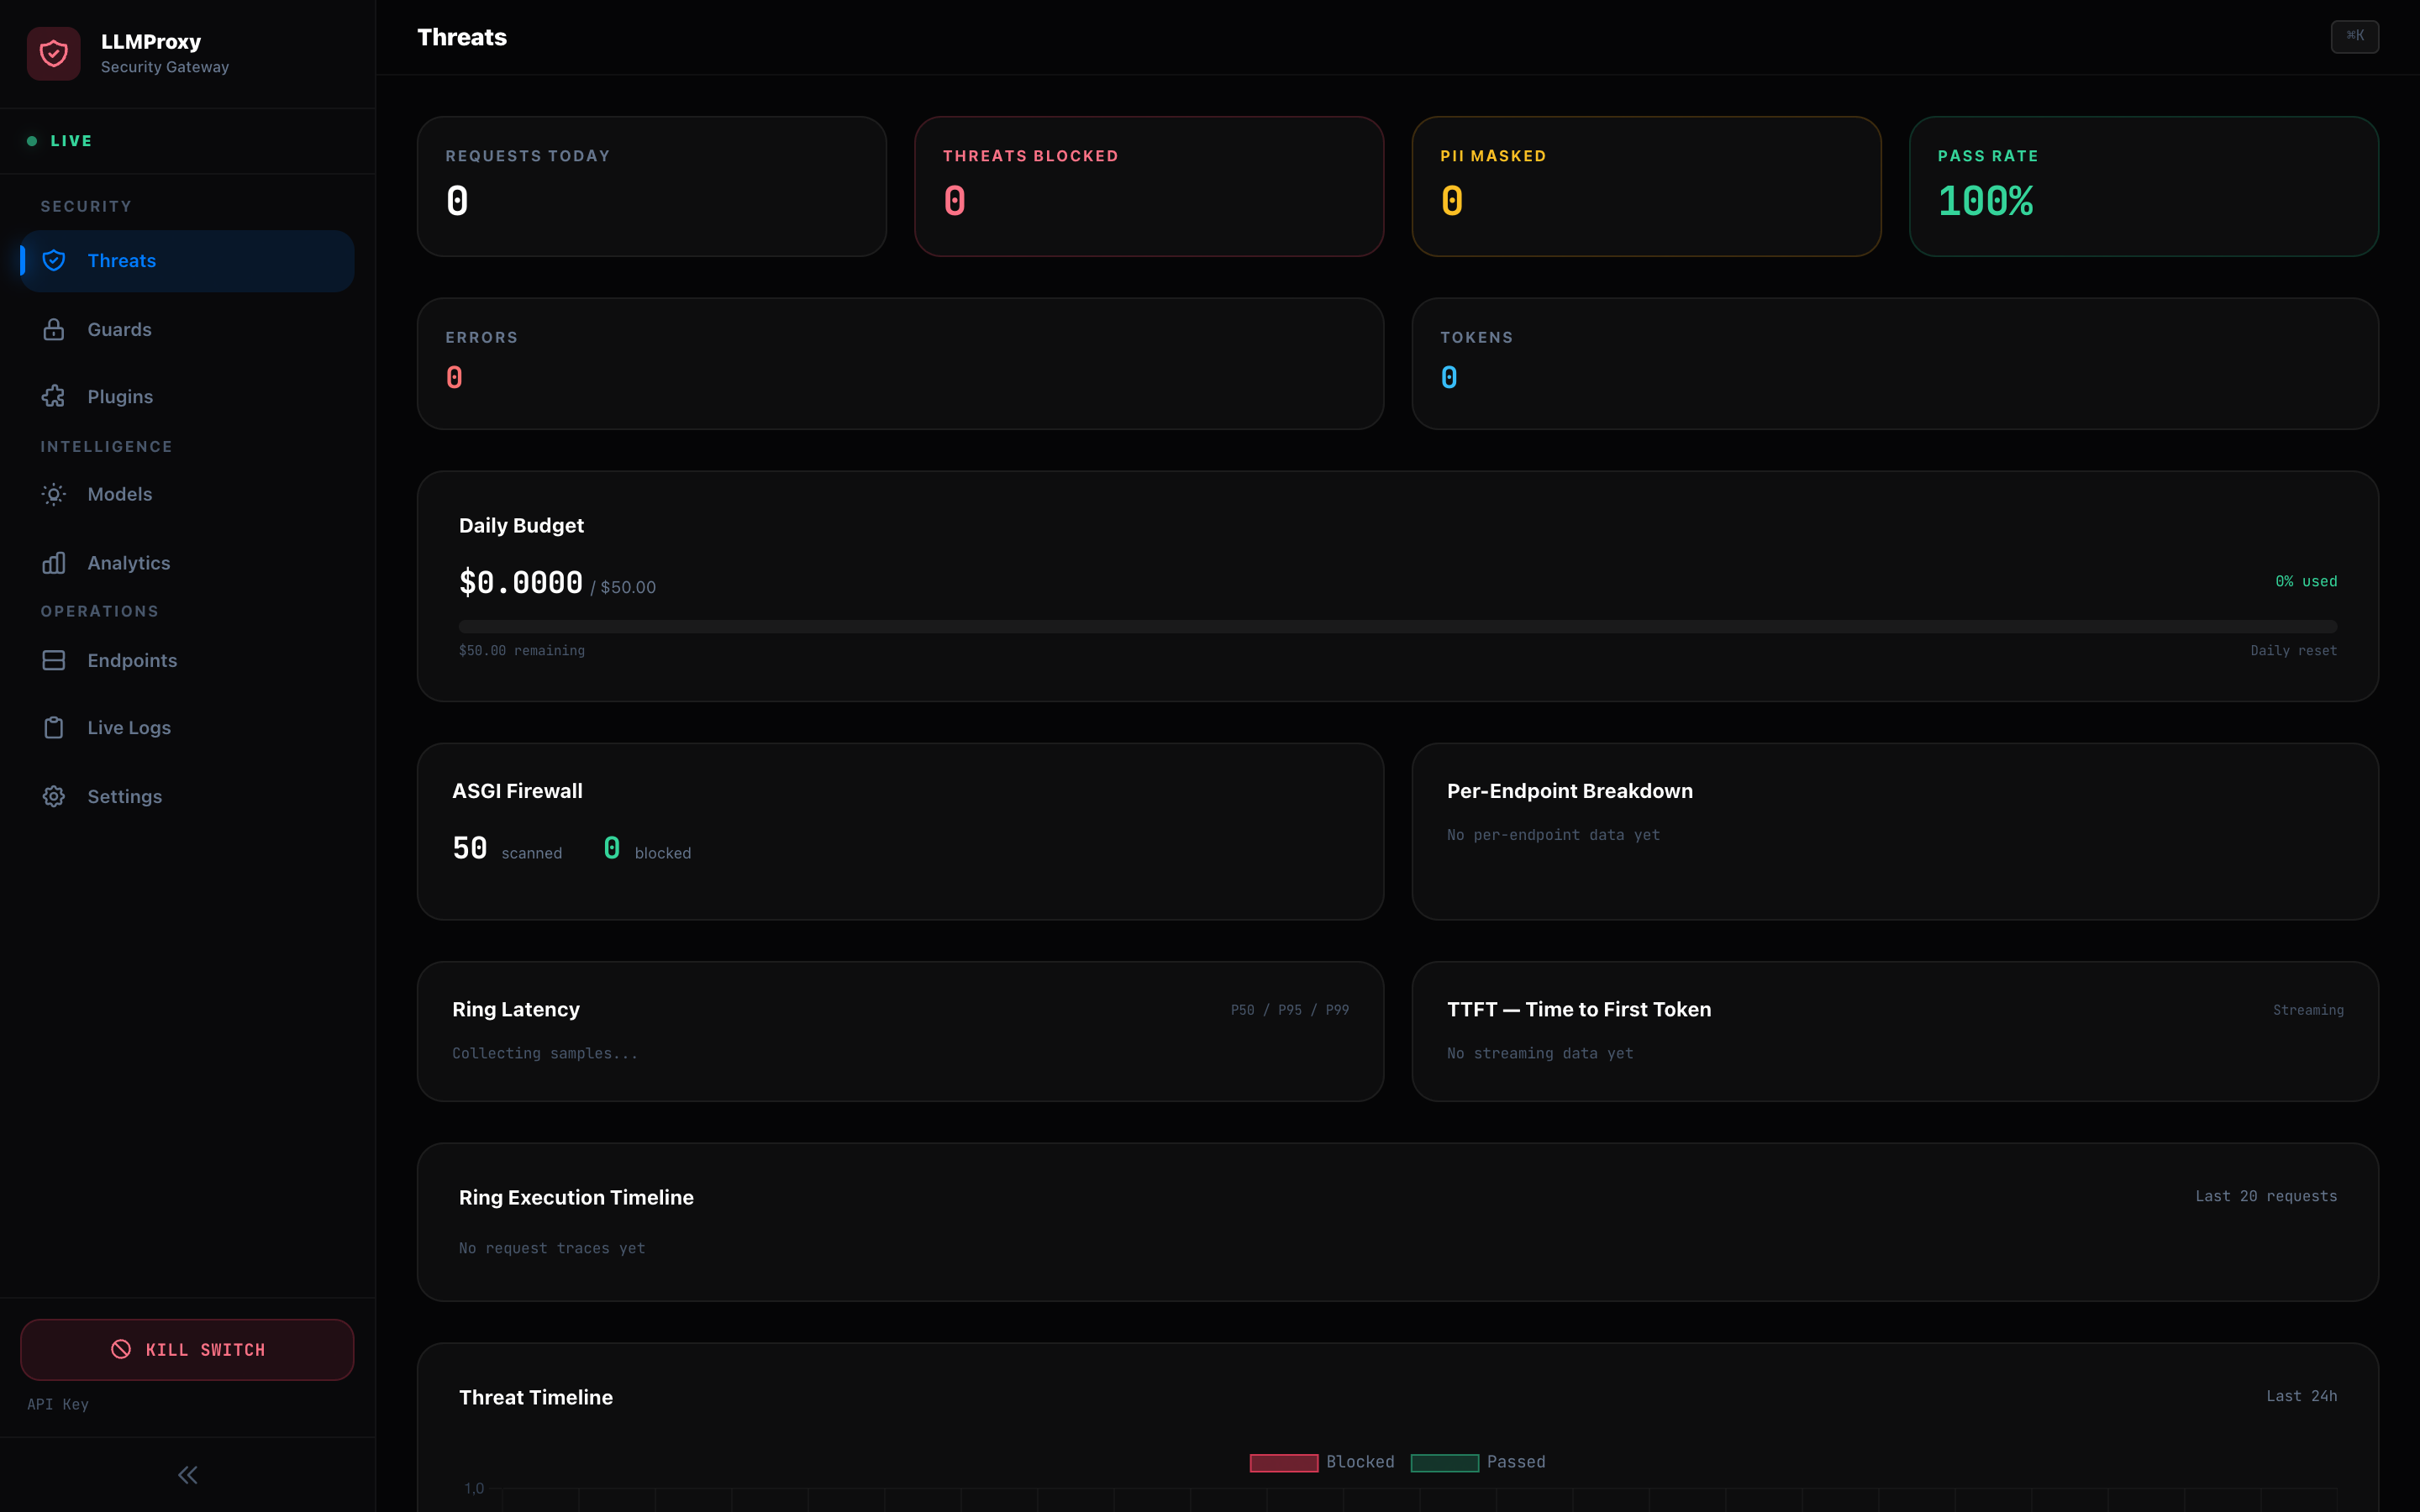
SOC Dashboard
The Security Operations Center is a real-time monitoring dashboard built with vanilla JS, Tailwind CSS, Chart.js, and xterm.js. Access it at http://localhost:8090/ui.
Views
| View | Description |
|---|---|
| Threats | KPI cards, threat timeline chart, real-time security event feed |
| Guards | Master proxy toggle, per-guard enable/disable controls |
| Plugins | Ring-based plugin pipeline grid, hot-swap, per-plugin stats |
| Models | Aggregated model registry, provider counts |
| Analytics | Spend breakdown by model and provider |
| Endpoints | LLM endpoint registry with toggle/delete actions |
| Live Logs | xterm.js terminal with real-time SSE log stream |
| Settings | Identity, RBAC, webhooks, data export configuration |
Keyboard Shortcuts
| Shortcut | Action |
|---|---|
Cmd+K / Ctrl+K | Command palette with fuzzy search |
F | Cinema mode (distraction-free) |
Features
- Real-time updates: SSE streams for threats, logs, and telemetry
- Network heartbeat: 5-second ping, LIVE/OFFLINE status indicator
- Kill switch: Emergency halt button in sidebar footer
- Glassmorphism dark theme: Rose accent matching the security brand
- Responsive: Mobile menu, sidebar collapse
Tech Stack
- UI: Vanilla JS ES Modules (no framework)
- Styling: Tailwind CSS CDN + glassmorphism effects
- Charts: Chart.js for threat timeline and analytics
- Terminal: xterm.js with WebGL renderer for live logs
- Streaming: Server-Sent Events (SSE) for real-time data